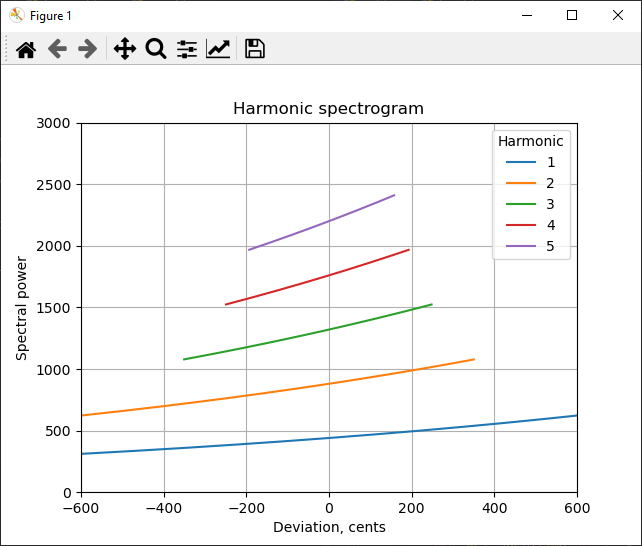
Я написал рабочее и полное доказательство концепции, которое показывает спектрограф в Matplotlib. Я хочу закрепить это доказательство концепции, прежде чем продолжить разработку, и я не в восторге от того, как мне пришлось взламывать, используя numpy.
График показывает спектр, разделенный на пять гармоник. Каждая гармоническая секция показана с центром вокруг гармоники, кратной основной гармонике, с отклонением от этого центра, измеренным в центы. Суть моей проблемы в том, что эти гармонические участки имеют переменную длину. Все секции извлекаются как срезы из единого плоского выходного массива БПФ. Этот выходной массив в настоящее время представлен как глобальный (хотя это изменится, когда я продолжу разработку), и его ссылка должна оставаться неизменной, и ее нельзя перераспределять: это необходимо из-за того, как работает библиотека FFTW. Планировщик работает с определенным разделом памяти, который необходимо при необходимости изменить.
Мой первый подход заключался в том, чтобы максимально приблизиться к представлению зубчатого массива, насколько позволяет numpy, что является маскированные массивы. Я использую замаскированный массив для cents, горизонтальные оси, так что linspace, *= и log операторы могут быть полностью векторизованы по всем гармоникам. Это работает, но, похоже, не приносит мне большой пользы, поскольку маскированный массив все еще нужно разрезать animate прежде чем быть переданным plot.set_data(). animate более критичен к производительности, чем set_note поскольку я планирую, что первый будет вызываться для каждого кадра анимации, а второй — только при нажатии клавиш.
from math import sqrt, log
import matplotlib.pyplot as plt
import numpy as np

n_harmonics = 5    # Number of harmonics to display
f_upper = 24_000   # Nyquist frequency
n_fft_out = 32769  # FFT output size for an input of 64k
h_indices = np.arange(1, n_harmonics + 1)       # Harmonic indices
coefficients = np.empty(n_harmonics + 1)        # Frequency coefficients to find harmonic section bounds
coefficients[0] = n_fft_out/f_upper / sqrt(2)
coefficients[1:] = n_fft_out/f_upper * np.sqrt(h_indices*(h_indices + 1))

# A spectrum that is linear from its lower to upper frequency
# This will eventually receive an actual spectrum
fft_out = np.linspace(0, f_upper, n_fft_out, dtype=np.complex64)


def f_to_fft(f: float) -> int:
    return round(f / f_upper * n_fft_out)


def fft_to_f(i: int) -> float:
    return i / n_fft_out * f_upper


def set_note(f_tune_exact: float):
    """
    will eventually be invoked via keyboard on an irregular basis (once every few seconds)
    """
    bounds_flat = np.empty(n_harmonics + 1, dtype=np.uint32)
    np.rint(f_tune_exact * coefficients, casting='unsafe', out=bounds_flat)
    bounds = np.vstack((bounds_flat[:-1], bounds_flat[1:])).T

    sizes = (bounds[:, 1] - bounds[:, 0])[..., np.newaxis]
    longest = np.max(sizes)
    cents = np.ma.empty((n_harmonics, longest))
    cents[:, :] = np.linspace(bounds[:, 0], bounds[:, 0] + longest - 1, longest).T
    past_end = np.arange(longest)[np.newaxis, ...] >= sizes
    cents[past_end] = np.ma.masked

    cents *= (f_upper / f_tune_exact / n_fft_out / h_indices)[..., np.newaxis]
    cents = 1_200/log(2) * np.log(cents)
    return cents, bounds


def plot():
    fig, ax = plt.subplots()
    plots = [
        ax.plot([], [], label=str(h))[0]
        for h in range(1, n_harmonics + 1)
    ]

    ax.set_title('Harmonic spectrogram')
    ax.legend(title="Harmonic")
    ax.grid()
    ax.set_xlim(-600, 600)
    ax.set_ylim(0, 3_000)
    ax.set_xlabel('Deviation, cents')
    ax.set_ylabel('Spectral power')

    return plots


def animate():
    """
    Will eventually be invoked often, at the framerate of the matplotlib animation.
    fft_out needs to remain outside of this scope because FFT routines need to
    refer to the same segment of memory without it being reallocated.
    """
    for plot, x, (left, right) in zip(plots, cents, bounds):
        x = x[:right-left]
        y = np.abs(fft_out[left: right])
        plot.set_data(x, y)


if __name__ == '__main__':
    cents, bounds = set_note(440)
    plots = plot()
    animate()
    plt.show()
Это показывает правильное:
Моя вторая попытка — это компромисс: в нем меньше векторизации, но и проще. animate не нужно ничего нарезать, так как harmonics полностью хранится по ссылке:
from math import sqrt, log
import matplotlib.pyplot as plt
import numpy as np

n_harmonics = 5    # Number of harmonics to display
f_upper = 24_000   # Nyquist frequency
n_fft_out = 32769  # FFT output size for an input of 64k
h_indices = np.arange(1, n_harmonics + 1)       # Harmonic indices
coefficients = np.empty(n_harmonics + 1)        # Frequency coefficients to find harmonic section bounds
coefficients[0] = n_fft_out/f_upper / sqrt(2)
coefficients[1:] = n_fft_out/f_upper * np.sqrt(h_indices*(h_indices + 1))

# A spectrum that is linear from its lower to upper frequency
# This will eventually receive an actual spectrum
fft_out = np.linspace(0, f_upper, n_fft_out, dtype=np.complex64)


def f_to_fft(f: float) -> int:
    return round(f / f_upper * n_fft_out)


def fft_to_f(i: int) -> float:
    return i / n_fft_out * f_upper


def set_note(f_tune_exact: float):
    """
    will eventually be invoked via keyboard on an irregular basis (once every few seconds)
    """
    bounds_flat = np.empty(n_harmonics + 1, dtype=np.uint32)
    np.rint(f_tune_exact * coefficients, casting='unsafe', out=bounds_flat)
    bounds = np.vstack((bounds_flat[:-1], bounds_flat[1:])).T

    sizes = (bounds[:, 1] - bounds[:, 0])[..., np.newaxis]
    longest = np.max(sizes)
    cents = np.linspace(bounds[:, 0], bounds[:, 0] + longest - 1, longest).T
    cents *= (f_upper / f_tune_exact / n_fft_out / h_indices)[..., np.newaxis]
    cents = 1_200/log(2) * np.log(cents)
    cents = [
        cent[:size[0]]
        for cent, size in zip(cents, sizes)
    ]

    harmonics = [
        fft_out[left: right]
        for left, right in bounds
    ]

    return cents, harmonics


def plot():
    fig, ax = plt.subplots()
    plots = [
        ax.plot([], [], label=str(h))[0]
        for h in range(1, n_harmonics + 1)
    ]

    ax.set_title('Harmonic spectrogram')
    ax.legend(title="Harmonic")
    ax.grid()
    ax.set_xlim(-600, 600)
    ax.set_ylim(0, 3_000)
    ax.set_xlabel('Deviation, cents')
    ax.set_ylabel('Spectral power')

    return plots


def animate():
    """
    Will eventually be invoked often, at the framerate of the matplotlib animation.
    fft_out needs to remain outside of this scope because FFT routines need to
    refer to the same segment of memory without it being reallocated.
    """
    for plot, x, y in zip(plots, cents, harmonics):
        plot.set_data(x, np.abs(y))


if __name__ == '__main__':
    cents, harmonics = set_note(440)
    plots = plot()
    animate()
    plt.show()
Я считаю, что второй, без маски, по ссылке, невекторизованный подход к формированию harmonics и cents разумнее. Я открыт для всех отзывов, но конкретно то, что мне действительно нужно, — это отзывы о преимуществах и недостатках этих двух подходов; если есть способ лучше использовать numpy / matplotlib; и особенно если есть способ получить свой торт и съесть его — получить действительно неровный массив numpy, который мне не удалось найти.

